In today’s fast-paced digital sphere, the competition for the top spot on a search engine results page (SERP) is fierce. With millions of websites vying for attention, Search Engine Optimization (SEO) is no longer a luxury, but an essential strategy for any online endeavor. One revolutionary tool that is increasingly shaping the SEO landscape is Natural Language Processing (NLP) and its analytical capabilities. In this comprehensive guide, we dive into the world ofAnalytics with NLP and SEO, demystifying how this AI technology can unlock a treasure trove of SEO wins.
1. Understanding the Basics
1.1 What is SEO?
Search Engine Optimization (SEO) is an online marketing strategy that focuses on enhancing a website’s visibility on search engine results pages. It involves a myriad of techniques, including keyword research, link building, and content optimization, aimed at attracting organic, or non-paid, traffic to a website.
1.2 What is Natural Language Processing (NLP)?
Natural Language Processing, commonly known as NLP, is a branch of artificial intelligence that enables machines to understand, interpret, and generate human language. Essentially, NLP bridges the gap between human communication and computer understanding, making it possible for machines to comprehend nuances, context, and meaning in human language.
1.3 How Does NLP Influence SEO?
In recent years, search engines like Google have been leveraging NLP technology to improve their understanding of online content, thereby providing more accurate and relevant results to users’ queries. With NLP, search engines can analyze the context and semantics of web content beyond mere keywords, making SEO more complex but also more opportunity-laden.
2. The NLP Revolution in SEO
2.1 Google’s BERT Update
In 2019, Google rolled out its BERT (Bidirectional Encoder Representations from Transformers) update, an NLP algorithm aiming to improve the understanding of the context of words in search queries. This update caused a significant shift in Google’s search rankings, underscoring the importance of catering content to natural language use and user intent.
2.2 AI-Powered SEO
The BERT update is just one manifestation of how AI, particularly NLP, is revolutionizing SEO and digital marketing practices. By understanding natural language texts more effectively, search engines can provide more accurate and relevant results, making it crucial for businesses to optimize their content in line with these linguistic advancements.
3. Unlocking SEO Wins with Analytics and NLP
3.1 Shifting from Keyword to Topic-Based Approach
Traditional SEO strategies have focused heavily on keywords. However, with NLP’s ability to comprehend broader topics and themes, there is a shift towards atopic-based approach. Here, an analytics platform, equipped with NLP, can analyze your website content’s topics instead of just individual keywords. This shift can help identify areas of interest for your audience accurately and expand your content creation efforts.
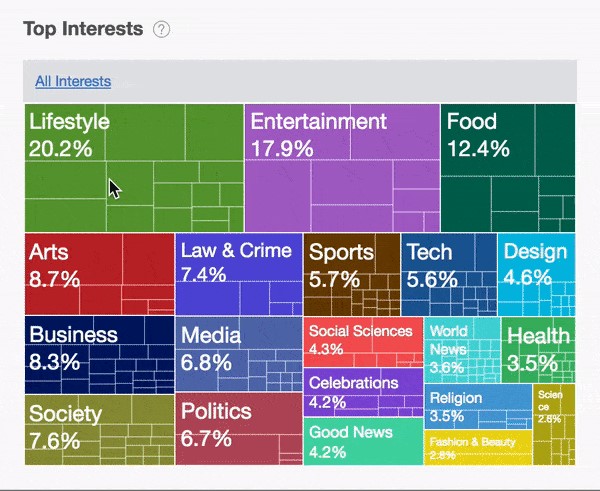
3.2 Surfacing Unknown Audience Interests
Analytics with NLP can offer insights into your audience’s interests and preferences. It can reveal non-obvious connections, such as your basketball content’s audience also being interested in European politics. Such unexpected affinities can be immensely useful in tailoring your content and SEO efforts.
3.3 Unearthing Hidden Keywords
While topics are important, individual keywords nested within these topics still hold value. Analytics with NLP can surface hidden relevant keywords, allowing you to broaden your content’s scope and target terms that might not have been previously considered.
3.4 Identifying Link-Building Opportunities
A smart analytics tool with NLP can recommend high-authority websites for link-building opportunities. By identifying hidden connections, it can suggest sites that you may not have considered before, thereby enhancing your SEO strategy.
Audience Interest Treemap on NativeAI Analytics for Publishers. Image Source:Mondovo
4. NLP and User Experience (UX)
AI technologies like NLP are not just reshaping the way search engines interpret and rank content, they are also transforming the user experience on websites. By understanding natural language and user intent more effectively, AI can help create a more personalized and engaging user experience, leading to improved dwell time and user satisfaction, which are crucial factors in SEO ranking.
5. Utilizing AI SEO for Your Website
5.1 Discovering Opportunities with AI SEO
AI-powered SEO tools can help you uncover untapped SEO opportunities faster and more efficiently. They can provide deeper insights into potential keywords, link-building opportunities, and other crucial aspects of an effective content strategy.
5.2 Enhancing Content Creation and Optimization with AI SEO
AI can assist in the creation of engaging and optimized content. By analyzing top-performing content, AI-powered tools can provide recommendations on the type of content to create, the optimum length, keyword usage, and more, enabling you to craft content that is not only SEO-friendly but also resonates with your audience.
5.3 Leveraging AI SEO for Voice Search Optimization
As voice-activated devices gain popularity, optimizing your content for voice search becomes increasingly important. AI SEO tools can help you create content that answers the questions users are asking their voice assistants, thereby improving your chances of ranking higher in voice search results.
5.4 Scaling Your SEO with AI
AI-powered SEO software can automate many labor-intensive aspects of SEO, from conducting website audits to content optimization, enabling you to scale your SEO efforts without overburdening your team.
5.5 Improving User Experience with AI SEO
AI can help enhance the user experience on your website by mimicking search engines and providing recommendations on how to improve your website’s UX. This can lead to increased dwell time and user satisfaction, which are crucial signals to search engines that your content is worth ranking higher on SERPs.
6. The Future of SEO and NLP
The future of SEO is bound to be heavily influenced by AI and NLP. As technology continues to advance, we can expect to see the use of NLP and machine learning in SEO becoming more widespread. This will allow for even more precise understanding of user behavior, enabling marketers to create content that engages their audience more effectively.
In conclusion, incorporating Analytics with NLP in your SEO strategy can unlock numerous opportunities for improving your website’s visibility and boosting your revenues. As AI continues to revolutionize the digital landscape, staying ahead of the curve by leveraging these advanced technologies will undoubtedly be key to achieving SEO success.
For a deeper understanding of this topic, you can check out this informativevideo which provides a comprehensive overview of the synergies between AI, NLP, and SEO.
I hope this article has provided you with valuable insights into the paradigm-shifting world of AI-powered SEO. If you have any questions or would like to share your thoughts, feel free to leave a comment below!
Department of Computer Application Integral University, Lucknow(U.P) Inida, Sambhram University Jizzax Uzbekistan
Mohd Muqeem2
Department of Computer Application Integral University, Lucknow(U.P) Inida
Introduction:
Bee Colony Algorithm
From past few decades, there rapid development of the advanced technology and IoT based sensor devices which resulted with an explosive growth in data generation and storage. The amount of data which is generated is constantly growing even exponential growing and thus cannot be predicted or even cannot find the hidden information traditional way. Indeed, many new applications producing this huge amount of data, especially those where users can write, upload, post and share a lot of data, information and videos, such as social media sites like Facebook, twitter, telegram, instagram where every second every minutes huge amount of image, video and data are post and shares . Accordingly, as mentioned in [1], it is approximately up to 45 Zeta bytes digital data we have up to 2020. In the Current information technology world, this huge amount and the massive volume of data with more attributes is called “High dimensional Big Data”. A lot of important frequent-pattern, meaningful information and valuable hidden pattern can be extracted from this huge amount of data, which help the organization for improving the business intelligence, decision-making, fraud detection etc. K-means clustering is a most important and powerful un-supervised partitioning machine learning techniques for division of this big data into homogenous group i.e. cluster [2][7][8].
There are lot of limitation of K-means in big and high dimensional data: it converges to the local optimal solution, no of cluster is to be defines in advance, initialization of clusters centroid, lack of quality of clusters [3]. We have proposed a hybridized K-means with nature inspired Artificial Bee Colony global optimization algorithm that resolve the limitation of K-means clustering.
Nature inspired optimization:
There are lot of Population-based meta-heuristic Evolutionary Algorithms (EAs) global optimization algorithms which are inspired by the natural behaviour of the population evolution such as Genetic Algorithm, Artificial Bee Colony (ABC), Artificial Ant Colony and particle swarm based intelligence algorithm.
Artificial Bee Colony
ABC is a global optimization met-heuristic algorithm which is inspired by the intelligent behaviour of honey bees. This algorithm is popular due to its flexible computational time. In our proposed method we use the ABC algorithm for the initialization and selection of cluster centroids [6].
This algorithm is executed in 4 steps as given below:
Initialization
Employed Bee
On-looker Bee
Scout bees
The objective function of Artificial Bee Colony (ABC) algorithm is designed as according to the optimal number of selection of clusters for K-means.
The population of ABC is initialized by equation 1. in which i=1,2,3,…….,BN, here BN defines the total number of food sources and value of j=1,2,3,………,D. D is the number of dimensions. The upper and lower bounds of the variable j is xmin,j and xmax,j.
Updation of the bees location is as given below
In above equation r ∈ 1, 2,3, ·····,BN and j ∈ 1, 2, ·····, D are indexes and Φ is a random generated number in between [−1, 1]. If new solution is better than old solution i.e. equation (2), than old solution will replaced by new one.
The of each solution is computed by where f iti is a probability fitness value of the i th solution. If fitness of new solution is higher than old solution than old will replaced by new solution.
Proposed methodology:
In our proposed methodology we hybridized the K-mean with ABC (ABK) comes up with the plan that K-means algorithm provide the new solution of scout bees in every iteration. The K-means generate the new solutions as according to the employed bee and onlooker bee steps. In this way we can get more optimized results. The new solution of K-means will be added in every iteration improve the accuracy for reaching ABC to higher level.
The new solution from the K-means is generated according to the solutions of the employed bee and the onlooker bee phases. This process may increase the chances of giving more suitable solutions for the optimization problem. The addition of new solution from K-means after every cycle may enhance the reach of ABC algorithm to a different level. Our proposed idea finds the fi values from the given below distance formula.
distance=min(ii,jj) (4)
The fitness function is the calculated be the given equation as the sum of all the distance i values.
In the above equation the population will be survived according to the better fitness otherwise it will reject [5].
TABLE 1[4] COMPARATIVE ANALYSIS BASED ON INTRA CLUSTER DISTANCE
Reference
Ilango, S. S., Vimal, S., Kaliappan, M., & Subbulakshmi, P. (2019). Optimization using artificial bee colony based clustering approach for big data. Cluster Computing, 22(5), 12169-12177.
Alam, A., Muqeem, M., & Ahmad, S. (2021). Comprehensive review on Clustering Techniques and its application on High Dimensional Data. International Journal of Computer Science & Network Security, 21(6), 237-244.
Saini, G., & Kaur, H. (2014). A novel approach towards K-mean clustering algorithm with PSO. Int. J. Comput. Sci. Inf. Technol, 5, 5978-5986.
Krishnamoorthi, M., & Natarajan, A. M. (2013, January). A comparative analysis of enhanced Artificial Bee Colony algorithms for data clustering. In 2013 International Conference on Computer Communication and Informatics (pp. 1-6). IEEE.
Bharti, K. K., & Singh, P. K. (2014, December). Chaotic artificial bee colony for text clustering. In 2014 Fourth International Conference of Emerging Applications of Information Technology (pp. 337-343). IEEE.
Enríquez-Gaytán, J., Gómez-Castañeda, F., Moreno-Cadenas, J. A., & Flores-Nava, L. M. (2020, November). A Clustering Method Based on the Artificial Bee Colony Algorithm for Gas Sensing. In 2020 17th International Conference on Electrical Engineering, Computing Science and Automatic Control (CCE) (pp. 1-4). IEEE.
Alam, A., Rashid, I., & Raza, K. (2021). Application, functionality, and security issues of data mining techniques in healthcare informatics. In Translational Bioinformatics in Healthcare and Medicine (pp. 149-156). Academic Press.
Alam, A., Qazi, S., Iqbal, N., & Raza, K. (2020). Fog, Edge and Pervasive Computing in Intelligent Internet of Things Driven Applications in Healthcare: Challenges, Limitations and Future Use. Fog, Edge, and Pervasive Computing in Intelligent IoT Driven Applications, 1-26.
Python is most powerful tool for Financial Analysis and Data Analysis. You can use python for Machine Learning and Artificial Intelligence.
Syllabus Content
Subject Name: Python for Financial Analysis
Unit
Title
Details of Topic
Unit I
Getting Started with Python
This unit will prepare the learner to use basic python for data analytics- This foundational unit will equip the learner to use the basic syntax of Python
Unit II
Numpy, General Overview of Pandas and Matplotlib
Numpy for financial analysis, General overview of pandas and visualization with matplotlib and pandas. Pandas with timeseries data. Capstone stock market analysis project.
Unit III
Time series analysis
Time Series basic, Introduction to basic Stat Model, ETS theory, EWMA Theory, ARIMA theory, ACF and PACF theory, ARIMA with stat model.
Unit IV
Python finance fundamentals, Calculating and Comparing Rate of Returns, Measuring Investment Risk
Introduction to python finance fundamental, Shape ratio, Simple and moving average, Calculating rate of return of individual share and portfolio. Calculating rate of return of Index. Calculating risk of individual share and portfolio Calculating index risk.
Unit V
Using regression in python, Markowitz portfolio optimization, Capital Assets Pricing Model, Multivariate regression analysis, Monte Carlo Simulations.
Calculation of simple regression. Calculation of Alpha, Beta and R squire in python. Markowitz portfolio optimization. Calculation of Multivariate regression.
Lesson Plan
U. No
Title
Details of Topic
Duration
Unit 1
Getting Started with Python
Installing Python, Installing Jupyter Notebook, Introduction of Jupyter Notebook and Google colab
Python variables, Data types, Basic Python Syntax, Python Operators.
Conditional statements, Python Functions, Python sequence, Iteration in Python
Object oriented programming, Modules and Package, Standard Library, Importing modules.
Unit 2
Numpy, General Overview of Pandas and Matplotlib
Introduction to Numpy, Numpy Array, Numpy operation, Numpy indexing
Introduction to Pandas, Series, DataFrames, Missing Data, Groupby with Pandas, Mearging, Joining, Concatenating DataFrame, Pandas common operations, Data input and output
Introduction to Visualization in Python, Matplotlib
Introduction ot data source, Note on PandasDatareader, quandl, Introduction to time Series with Pandas. Datetime Index, Time resampline, Time Shift, Pandas Rolling and Expanding.
Introduction to time series, Time series basic, Introduction to stat models,
ARIMA theory, ACF and PACF, ARIMA with Statmodels, Discussion choosing PDQ.
Unit 4
Python Finance Fundamentals, Calculating and Computing Rate of Returns. Measuring Investment Risk
Welcome o the Finance Fundamentals, Sharp Ratio, Portfolio Allocation Code Along, Considering Both Risk and Retrun, Calculating Security Rate of Retrun (Simple retrun and logarithmic return),
What is a portfolio of securities and how to calculate its rate of return, Popular stock indices that can help us understand financial markets, Calculating the Indices’ Rate of Return
Calculating the Indices’ Rate of Return, Calculating a Security’s Risk in Python, The benefits of portfolio diversification, Calculating the covariance between securities, Measuring the correlation between stocks
Calculating Covariance and Correlation, Considering the risk of multiple securities in a portfolio, Calculating Portfolio Risk, Understanding Systematic vs. Idiosyncratic risk, Calculating Diversifiable and Non-Diversifiable Risk of a Portfolio
Unit 5
Using regression in python, Markowitz portfolio optimization, Capital Assets Pricing Model, Multivariate regression analysis, Monte Carlo Simulations
The fundamentals of simple regression analysis, Computing Alpha, Beta, and R Squared in Python
Finance -Markowitz Portfolio Optimization, Obtaining the Efficient Frontier in Python
The intuition behind the Capital Asset Pricing Model, Understanding and calculating a security’s Beta, Calculating the Expected Return of a Stock.
Multivariate regression analysis – a valuable tool for finance practitioners, The essence of Monte Carlo simulations
Batch 1: The course started on the 15th and was completed on the 20th of June 2022 and on the 11th of August 2022.
In this post, we’ll look at the business analyst profession, which is one of the most common job options in the corporate sector. We’ll learn what a business analyst is, what they do, how much money they make, and what skills and education you’ll need to become one. Also the difference between Business Analyst and Data Analyst.
Alright! Now, let’s start with a brief overview of the business analyst profile.
Who are Business Analytics and how do they fit inside a company?
At first glance, the term “Business Analyst” may appear generic, which may cause concern among entry-level candidates. However, because the business analyst profession involves many various operations in a company, the fact that it is a versatile position may be promising. This might be an entry-level employment or a role for seasoned professionals, depending on the organisation. As a result, business analysts are responsible for a wide range of responsibilities, and job descriptions vary greatly from one company to another. Business analysts will be focused on the following types of activities in various businesses:
Process and systems improvement (in terms of efficiency and effectiveness)
Solving business problems
Looking for savings and efficiencies
Focusing on business development and searching for new opportunities
Performance analysis
Competitor analysis Indeed,
Data Analysits
One of the most dynamic roles in a firm is that of a “business analyst.” They may be reporting their results to the head of a certain division to which they have been assigned, or they may be discussing a specific instance with a product or project manager. In some cases, the business analyst serves as a mediator between the business development manager and the head of division or product owner. One thing is certain: you will never be bored at work.
That is the elevator pitch for this excellent career opportunity. However, in order to obtain a greater idea of what it means to be a business analyst, we must examine their typical day-to-day responsibilities. So,
What do business analysts do?
The answer is that it depends. Business analysts are expected to perform a variety of tasks in various organisations. However, these are some of the most prevalent responsibilities.
A business analyst examines the performance of a specific segment within a corporation. They frequently engage in the analysis of various processes, identifying goals, and creating hypotheses. Their goal is to improve the performance of the specific section of the firm to which they have been allocated. They not only gather data, but also use data-driven decision making, convey results, and oversee their implementation.
Furthermore, business analysts frequently train non-technical team members. As a result, we can confidently state that business analysts are the finest communicators among issue solvers, and they are always willing to contribute their expertise throughout the firm. Sales, supply chain, and administration are some of the divisions to which business analysts may be assigned. Within that structure, they do research, rely on data as much as possible, and are generally involved in the creation of dashboards and other BI tools to facilitate the sharing of their results. As you can see, being a business analyst is a difficult job…but it can also be incredibly rewarding!
Now that you know what it’s like to be a business analyst, let’s look at your options and how you can get started.
A job as a business analyst is an excellent alternative to consider, both on its own and as the first step on the career ladder to becoming a Product Lead, Head of Product, or Head of Division, and, why not, a Vice President. Full-time business analyst employment are available in the majority of midsize and big organisations across all industries, including consulting, finance, and technology.
Consultancy is also quite popular in this field, particularly in smaller firms. However, as compared to their counterparts hired by a corporation in a specialised industry, this alternative gives a business analyst with a limited picture of the business.
Data Analyst and Business Analyst
So, what are the essential abilities required to apply for a job as a business analyst?
According to a review of 1,395 job postings, business analyst applicants must have the following tools and skills. Here’s what the numbers show:
60% of job postings emphasized Excel skills
41% mentioned strong communication
6% requested Tableau
and 4% – Power BI
What about the educational background?
A Bachelor’s degree is required for 66 percent of job openings.
This is the standard for this field. In terms of experience, most businesses in our sample required an average of four years on the job, although 35% of job advertising were also appropriate for those with no prior working experience.
To summarise, if you want to increase your chances of securing a business analyst position, you must be fluent in Excel, have great communication skills, and potentially master a BI software (such as Tableau or PowerBI). However, python is also gaining great popularity.
Alright! You now understand the most significant components of the business analyst role, what to anticipate from it, and what talents you should work on to become one.
Difference between a business analyst and a data analyst
Financial Analyst
I will discuss the difference today under four main headings the first is responsibilities the next is qualifications skills and then salary
Work with client to understand the problem
So, to begin with, let’s look at the business analyst. The business analyst will spend a lot of time with the customers to understand what they need and what difficulties they’re experiencing, and then they’ll work with the managers to figure out how that’s going to work within their team.
Use current data to outline problem
The second step is to use current data to outline the problem, so they’ll have to go in and actually look at the data to understand what that client is looking for so that they can convey to the team what they’re trying to solve and what they’re looking for.
Outline and communicate the client problem to team.
Then they’ll describe and communicate to the team what the client genuinely wants, what the problem is, what they’re attempting to solve, and how we’re going to get there.
Business Analytics
Often, the business analyst will conduct all of the analysis and then pass it on to either the programming team or a data analyst to investigate further and resolve the issue.
Work with the Programming teams
work with the programming teams that collect and analyse the data The distinction between these two is that the business analyst will normally deal with the client side and management, whilst the data analyst will work with the programming side.
Use pre-existing data to solve a problem
Next, they’ll use pre-existing data to address the problem, so the business analyst will bring the problem, describe it, and present it to the programming team, and then the data analyst, along with the programmers or developers, will solve the problem and figure out a solution.
Create report and dashboard
Next, they’ll develop reports and dashboards, which is a requirement for any data analyst position, or they’ll create some form of visualisation
Present Analytical Finding to team
The last thing you’ll do is offer analytical findings to the team, so the business analyst will bring the problem to the team, and the data analyst will report back to the team with their findings and a possibility or potential remedy.
Next we’re going to look at qualifications
A bachelor’s degree or higher is necessary, and the criteria for the business are actually quite comparable unless you’re going to need a bachelor’s degree in normally it’s going to be anything in business and administration finance economics something business-related
Master requirement in sum position (MBA, M.Com or equivalent)
You may need a master’s degree, and business analysts, who frequently have MBAs, are the most common candidates.
Typically, data analysts do not have MBAs, but let’s look at that one next, thus for a data analyst
Bachelor’s degree or higher is preferred
A bachelor’s degree is also required, generally in computer science, statistics, mathematics, economics, or finance, and as you can see, there is a lot of overlap between the business analyst and the data analyst.
Masters required for some position
You may also require a master’s degree for some roles, and it isn’t always an MBA, such as a business analyst; sometimes they’re looking for statistics, mathematics, or an actual analytics master’s degree, and so those are some of the qualifications that differ between these two positions.
Skills
So, for a business analyst, you’ll need skills like knowing Microsoft Access and Excel, and those are some of the more technical skills you’ll need, but you’ll also need really solid soft skills like communication skills, presentation skills, and just general people skills. be able to successfully engage and converse with clients or members of the team
So for data analytics, you’ll need a little bit more technical skills, so you’ll be using things like sequel or in Python tableau or a data visualisation tool, you’ll be doing data modelling, so you’ll need to know SAS or SPSS Excel, and then some type of cloud platform like Azure or Amazon Web Services.
Salary
Business Analyst Salary in India
In this section, I will cover the average salaries earned by Business Analysts in India based on their position levels in a business and the Indian states in which they operate. I will also analyse the salaries offered by some of the largest firms in India to Business Analysts, based on job postings and salaries posted on Glassdoor.
Now discuss based on their experience and position levels.
Business Analyst Salary for Freshers
In India, the starting salary for a Business Analyst is between ₹350k and ₹500k per year. This is the compensation range for a professional with less than one year of experience. A Business Analyst’s remuneration rises in tandem with his or her level of expertise. Business Analysts with 1–4 years of experience may earn up to ₹523k per year, while those with more than 5 years of experience can earn up to ₹831k per year.
Senior Business Analyst Salary in India
Expert Business Analysts with 15+ years of industry expertise can earn up to ₹1,290k per year, albeit this varies based on position level and firm. Furthermore, you can see the wage packages of these professions in a variety of regions and towns across the country.
Business Analyst Salary in Bangalore
Bangalore, as we all know, is the nation’s IT capital. This Karnataka city boasts one of the most job postings for several IT professions, including Business Analysts. As a result, Business Analysts are among the city’s highest-paid IT workers. In Bangalore, Karnataka, business analysts make an average annual salary of ₹660k.
Business Analyst Salary in Delhi
Business Analysts in New Delhi make an average annual salary of ₹600k, which can rise to ₹1,251k with experience.
Business Analyst Salary in Chennai
Because there are several chances for individuals with a technical background in Chennai, the average pay of Business Analytics specialists in Chennai is substantially greater than in other cities. Business Analysts in Chennai make an average of ₹775k per year. Based on experience and skills, this income can be increased to ₹1,371k per year.
Business Analyst Salary in Hyderabad
Business Analysts in Hyderabad, Telangana, earn roughly ₹680k per year. This figure might rise to ₹1,345 per year depending on characteristics such as abilities, experience, and expertise. After learning about the incomes made by Business Analysts based on geography, we can now look at the salaries paid to Business Analysts by some of the world’s most well-known firms.
Average Salary of Business Analysts in Popular Indian Organizations
Now, I’ll go through the compensation Business Analysts earn at Accenture, Capgemini, Tata Consultancy Services (TCS), and other significant firms in India that give the top pay packages to these individuals.
The typical salary for these experts at Accenture is ₹705k per year, while Capgemini pays around ₹703k. Analysts at TCS earn an average of ₹697,000 per year.
Companies such as HCL and Wipro, on the other hand, provide a lower sum than the aforementioned companies. Wipro and HCL pay roughly 580k and 521k per year for Business Analysts, respectively.
Salary of a Data Analyst in India
The title of ‘Data Analyst’ is one of the most sought-after job alternatives and one of the highest-earning specialists in the field of information technology. Companies generate a tremendous volume of data every day, which is why these experts have a variety of career prospects.
According to PayScale, the average compensation for a Data Analyst in India is ₹432k per year. However, the income of Data Analysts varies depending on a variety of factors such as the city, the organisation, the job position, the job role, work experience, and so on. We shall go over them in depth in this blog post on ‘Data Analyst Salary in India.’
Data Analyst Salary in India by Experience
A Data Analyst with less than a year of experience can expect to earn around ₹342,716 per year as a starting salary in India. This is the starting salary for a Data Analyst.
Data Analysts with 1–4 years of industry experience make ₹414,330 per year on average.
Experienced Data Analysts with 5–9 years of professional experience may earn an average annual salary of ₹676,056.
Expert Data Analysts with 10–19 years of experience can expect to earn around ₹918,116 per year.
Senior Data Analyst salaries in India are ₹1,750,000 per year for experts with more than 20 years of industry expertise.
Data Analyst Salary in India by City
We will now learn about the pay of Data Analysts in various sections of the country.
Data Analysts in Bangalore, Karnataka, make approximately 17.7% more than the national average. The average annual income in this area is ₹508k.
These professionals make around 6.6 percent less than the national average in Mumbai, Maharashtra, with a salary of ₹403k per year.
In Hyderabad, Telangana, data analysts make around 4% less. The city’s average yearly salary for Data Analysts is ₹442k.
The average salary for Data Analysts in Kolkata, West Bengal is 6% lower than the national average. Data Analysts earn an average of ₹408k per year in this city.
Data Analysts earn around ₹404k per year in New Delhi, which is 6% less than the national average.
Data Analyst Salary in India by Company
Mentioned below are the average salaries earned by Data Analysts in various companies in India (in no particular order):
Tata Consultancy Services: ₹439k/year
Accenture: ₹494k/year
Ernst & Young (EY): ₹408k/year
Amazon: ₹450k/year
Genpact: ₹350k/year
HSBC: ₹712k/year
Capgemini: ₹316k/year
Cognizant: ₹525k/year
Deloitte: ₹540k/year
IBM: ₹548k/year
Data Analyst Salary in India by Job Profile
In India, the Data Analyst salary varies according to the job profiles as follows:
Do you want to know how your target audience feels about your brand? Do you want to improve your online reputation? Prevent social media meltdowns before they happen. When it comes to answering yes, social media sentiment analysis is now more than ever before. Here’s everything you need to know about sentiment analysis, from what it is and how it works to why you should use it in your business.
Using sentiment analysis, or gauging public sentiment, is beneficial to any marketer
It adds dimension to your social media performance monitoring by enabling you to comprehend not only the content, but also the context of what users say online. This invaluable insight, which can only be gained through sentiment analysis, will reveal areas where your strategy needs to be fine-tuned to improve your results. Nonetheless, many businesses fail to capitalise on this opportunity.
Why?
The firm doesn’t know how to make use of sentiment analysis for social media, or even what sort of rewards it would provide.
Do you recognise these concerns? We will provide you with instructions on how to correctly perform sentiment analysis and use it to guide your business strategy.
What is sentiment analysis and how does it work?
Here is a simple definition of sentiment analysis:
Sentiment analysis is the technique of recognising and categorising users’ expressed opinions in text.
Sentiment Analysis
You may automate this process by reading through and categorising each message, remark, or review you receive from your audience. This procedure is incredibly time consuming, since you must filter through millions of talks in your group. To expedite the process, you can automate your sentiment analysis efforts and let intelligent algorithms handle the heavy lifting. As a result, you can instantly assess whole campaigns, compare their outcomes, and even track their evolution over time.
We will not go into detail about the mechanics of automated sentiment analysis in this section. On a fundamental level, however, it entails modern technologies, such as machine learning, natural language processing, and classification of text polarity.
All of these procedures enable you to determine the sentiment of any written content on the Internet. However, because people are particularly interested in social media, we’re going to examine how sentiment analysis works on social media sites.
Exhibit of automated sentiment analysis
Consider the following review on your Facebook page:
“I truly enjoy how simple this product is to use and how well it assists my team in completing their daily chores.”
Upon reading this sentence, it is clear that the review is positive.
However, how are computer algorithms going to determine its sentiment?
To begin, they would scrutinise each word in the review and determine whether they communicate a favourable, negative, or neutral attitude. They would then count the number of words in each category and give a sentiment type based on this count.
Sentiment Analysis
In the reviewed passage, three positively charged words – “enjoy” , “simple”, and “well” – suggest that the entire sentence is favourable.
Of course, this is a fairly simplistic example, and your audience is likely to send you more intricate signals. However, complexity is not a concern for the algorithms that perform social media sentiment analysis. Today’s powerful sentiment analysis algorithms can quickly decipher and assess the sentiment of nearly any written message. As a result, you can swiftly ascertain the sentiments and emotions conveyed by your audience’s words and reply properly.
What is the difference between social media sentiment analysis and listening?
Given the preceding scenario, you may be wondering how sentiment analysis differs from listening.
Allow me to summarise:
Social media listening is the process of monitoring discussions across social media platforms in order to ascertain what is being said about topics of interest to you.
Social media sentiment analysis is the technique of monitoring conversations across social media platforms and determining their context in order to comprehend your audience’s feelings and emotions.
Sentiment analysis, in essence, offers an essential layer of insight to social media monitoring.
It supplements the data gathered from listening and aids in the development of a more accurate picture of ongoing online discussions about your organisation.
The Advantages of Sentiment Analysis for Brands
There are numerous advantages to social media sentiment analysis that your organisation cannot afford to skip.
Five of the most critical are as follows:
Monitoring the perception of your brand. Sentiment analysis is critical for monitoring your brand’s social media reputation. It enables you to ascertain users’ perceptions of your organisation and determine what efforts you should take to improve your brand’s image.
Enhancing the sensitivity of your performance analysis. Occasionally, raw KPI data might not tell the complete storey. Social media sentiment research contextualises your performance and elucidates why particular phenomena, such as engagement spikes or follower growth, occur.
Acquiring competitive intelligence. You are not limited to measuring merely the sensations and emotions associated with your brand. Sentiment research is also effective at revealing people’ perceptions of your competitors, which can help you make more informed tactical decisions and stay ahead of the competition.
Enhancing your audience’s relationships. It is critical to understand how your audiences feel about your business in order to develop long-lasting client relationships. It enables you to customise your content and community management tactics and to ensure that your messaging is correctly received.
Recognize and avert possible disasters. Monitoring your audience’s emotions can serve as a crisis detector. By spotting an early influx of negative tone signals, you may anticipate an impending issue and take action to avert it before it spreads.
The Bottom Line
Social media sentiment research expands your performance insights to a whole new level. It allows you to discover your audience’s feelings about your brand, which can help design and improve your social media marketing approach.
So, don’t be afraid to experiment with sentiment analysis and see what benefits it might bring to your business!
Sentiment analysis is in high demand in today’s marketing world. Consequently, sentiment analysis has increased rapidly in importance in the marketplace, and it now holds the position of being the most critical tool in a marketer’s toolkit. That’s because many software companies are eager to get on board with this cutting-edge trend, and that’s why there are so many tools out there. Even though you’ve chosen the best tool for the job, you may discover that it’s beyond your budget. Here are eight excellent sentiment analysis tools, ranging from high to low to help you determine which to use.
Freely Available Tools
We all enjoy a freebie, and the world of sentiment analysis is no exception. A few free tools are available. While these are not the most powerful or accurate on the market, they can be extremely beneficial for those just getting started on a tight budget.
If you are just looking to monitor commentary on Twitter, Dr. Christopher Healey’s app is a handy piece of technology. This tool utilises the convenience of a web app to search for and retrieve relevant Tweets from the last seven days (the range may be a little shorter for more popular topics). Once the Sentiment Visualization app generates colour-coded results for the keyword in an easy-to-read map, it will present the results to the user. Twitter users’ individual tweets are viewable using scatter graphs because users are able to scroll their mouse over bubbles. It is clear from these graphics that each Tweet’s position in relation to:
Pleasure conveys the tweeter’s happiness.
Activation indicates how enthusiastic the tweeter is.
Dominance indicates how much this specific term dominates the overall sentiment of the section of text.
The advantages of the NCSU Tweet Sentiment Visualization App are that it is free to use.
While Meaning Cloud isn’t as well known as Dr. Healey’s application, it’s used by small and medium-sized businesses to stay competitive. The text classification, topic extraction, and section-of-speech tagging tools are all completely free to use. Unlike the Tweet Visualizer, Meaning Cloud is cross-platform, including Facebook. Along with straightforward text classification, users can enhance results by uploading custom dictionaries to Meaning Cloud. Meaning Cloud also includes a convenient Excel add-in, but it is not compatible with Excel for Mac.
The Advantages of Meaning Cloud
Entirely free to use
Excel add-in with a variety of features Custom dictionary option
Accuracy
Tools for the budget range
Affordable sentiment analysis tools are readily available for people that need it — I highlight a number of our favourites:
You may have heard that before as one of the most popular tools for mid-range sentiment analysis. Social Mention is a powerful search engine, which searches for your brand name through over 100 social media services. It will then give you the results in a single, simple list. Users can use keyword or sentence to set their search and then filter the results. The engine provides four key measurements designed to show you and the emotion behind the words. Social Mention can be used for free, and can quickly tell you if the overall tone of the words is positive, neutral or negative. Users can check their competitors as long as they are at them, of course.
SocialBakers may be the one for you, if you are looking for an affordable way to cook a marketing storm. Socialbakers are a great way to automatically analyse the feeling and brand involvement of your business in an easy-to-use perception tool. Social Bakers provides the results of all-round sentiment analysis on a wide variety of platforms and forums.
The curiously named TIFY is a sophisticated marketing tool. TIFY uses proprietary models to analyse this information quickly by collecting information from social media posts, news websites, blogs, reviews and video publishing websites. TIFY uses intuitive visuals and infographics to show the search results, one of the user-friendly and eyecatching interfaces. These simple results are ideal to read and understand what is happening online with your brand and to solve any problems.
TIFY benefits
Accessible to the SME
Flexible packages for price
Well-precise
Excellent interface
Big Spender, you there?
Just as if your brand is on the smaller side and is a SME, or if you’re just seeking a bit more power with your sentiment analysis, it’s time to take the next step and employ the heavy artillery. This is a must: you need a wallet that’s capable of handling the task.
Very well-known In 2010, the company called Repustate was founded and currently has more than 3,000 customers in six continents. Repustate, a newly launched tool, provides content providers with access to insights obtained from online media and outlets in 23 languages.
As a rising star in the sentiment analysis world, UberVu is positioned well. UberVu scans all the popular websites and social media platforms for mentions of your brand, working with giants such as Microsoft and PayPal. In order to display results quickly and easily, it then organises its findings into an easy-to-read social intelligence dashboard. UberVu looks good and performs admirably when it comes to accuracy.
Lionbridge AI offers a full service for brands looking for the best that sentiment analysis has to offer, thanks to access to over 500,000 contributors from around the world and in 300 languages. Text analysis, social listening, and emotion analysis are included among the services. The Lionbridge AI service prices are only available on request, but are said to be neither inexpensive nor particularly expensive.
The advantages of using Lionbridge AI
artificial intelligence-driven
extremely precise
Multilingual
Personal attention
Conclusion
It is true that each of the tools in our categories has its own advantages, just like in life. Tools and freebies that are of limited use for experienced sentiment analysis practitioners. Higher-end models are typically more powerful, accurate, and feature-rich.